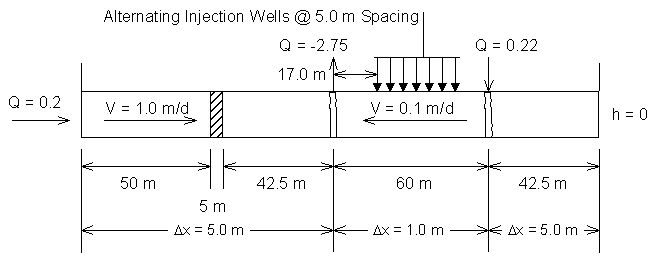
Figure 5.5.1 Pump and Treat with Biodegradation Aquifer System Layout
| [TOC] | 5.5 Pump and Treat with Biodegradation | [Prev. Page] | [Next Page] |
An alternative to higher pumping rates may be addition of methane and oxygen into the aquifer to stimulate methanotrophic degradation of TCE. This simulation takes the previous aquifer and adds biostimulation.

Figure 5.5.1 Pump and Treat with Biodegradation Aquifer System Layout
This scenario adds 4 methane and 3 oxygen injection trenches at a spacing of 5.0 m. It uses prescribed concentrations of oxygen and methane to represent the injection process. The simulation assumes water flux due to nutrient injection is negligible.
This scenario adds four new parameters: oxygen, methane, biomass, and a mass balance tracking parameter "TCE degradation". Figure 5.5.1 presents the added components.
Table 5.5.1 Pump-and-Treat with Biodegradation parameters
| Parameter | Type |
Initial Value |
Comment |
|---|---|---|---|
| O2 (aq) | Mobile | 0 mg/L | Parameter representing oxygen. |
| CH4 (aq) | Mobile | 0 mg/L | Parameter representing methane. |
| X | Immobile | 0.1 mg/L | Parameter representing biomass. |
| TCE degraded | Immobile | 0 mg/L | Parameter to track degraded TCE for mass balance calculations. |
Five additional reactions occur in this scenario; biomass growth, biomass decay, TCE decay, oxygen injection, and methane injection. Aqueous TCE decay is competitive with methane concentration. The equation representing TCE degradation is:
 |
(5.12) |
Where: k2 = maximum TCE degradation coefficient (0.01 mg TCE/mg biomass·day) X = biomass concentration (mg/L) TCE(aq) = aqueous TCE concentration (mg/L) O2(aq) = aqueous oxygen concentration (mg/L) KS,TCE = TCE saturation constant (1.0 mg/L) KS,CH4 = methane saturation constant (2.0 mg/L) KS,O2 = oxygen saturation constant (1.0 mg/L)
Units are consistent for this process. The stoichiometry for the above reaction is:
| (5.13) | |
| (5.14) |
Equation (5.14) includes the process of intermediate toxicity. The coefficient (20.83 mg biomass/ mg TCE) is from Alvarez-Cohen et al., (1993).
Biomass growth is a competitive process with methane. The rate of methane consumption due to biomass growth is:
 |
(5.15) |
Where: k = maximum substrate utilization rate (1.2 mg CH4/mg biomass·day) X = biomass concentration (mg/L) CH4(aq) = methane concentration (mg/L) O2(aq) = oxygen concentration (mg/L) KS,TCE = TCE saturation constant (1.0 mg/L) KS,CH4 = methane saturation constant (2.0 mg/L) KS,O2 = oxygen saturation constant (1.0 mg/L)
Units are consistent for this reaction. The stoichiometry is:
| (5.16) | |
| (5.17) |
Where: F = stoichiometric ratio of oxygen to methane consumption for biomass growth (mg O2/mg CH4) Y = biomass yield coefficient (mg biomass/mg CH4)
Endogenous biomass decay is a single Monod relationship with oxygen and biomass concentrations.
 |
(5.18) |
Where: X = biomass concentration (mg/L) b = maximum decay rate (0.15 mg biomass/mg biomass·day) O2(aq) = oxygen concentration (mg/L) KS,O2 = oxygen saturation constant (1.0 mg/L)
Units are consistent for this reaction. The stoichiometry is:
| (5.19) | |
| (5.20) |
The simulation uses a prescribed concentration of 10.0 mg/L to represent oxygen injection. It uses a variable methane injection concentration to avoid excessive or insufficient biomass growth.
| (5.21) |
Where: CH4,(aq) = aqueous methane concentration (mg/L) TCE(aq) = aqueous TCE concentration (mg/L) X = biomass concentration (mg/L)
The coefficients in equation (5.21) represent a linear combination that results in d X/d t = 0 when X = 20 mg/L. The simulation targets maximum biomass concentrations of 20 mg/L. Semprini (1991) modeled in-situ biostimulation with maximum biomass concentrations up to 50 mg/L.
Figure 5.5.2 illustrates the TCE concentration at the outlet boundary as a function of time:
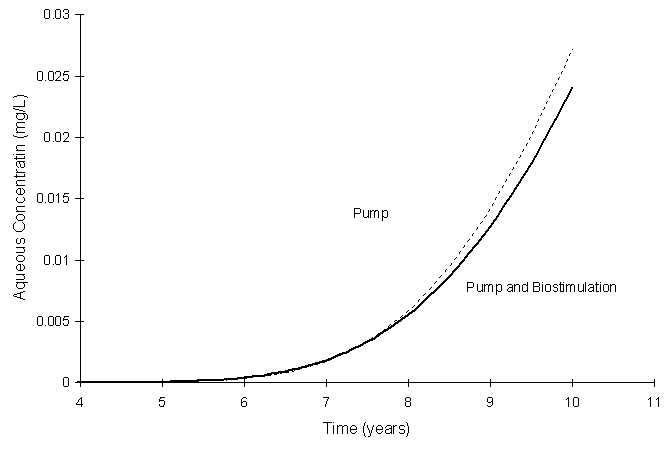
Figure 5.5.2 Pump and Treat boundary TCE concentration with and without
Biodegradation
It appears that adding biostimulation to the pump and treat scenario had little success in maintaining the required TCE concentration at the aquifer boundary. This is also illustrated in Figure 5.5.3.
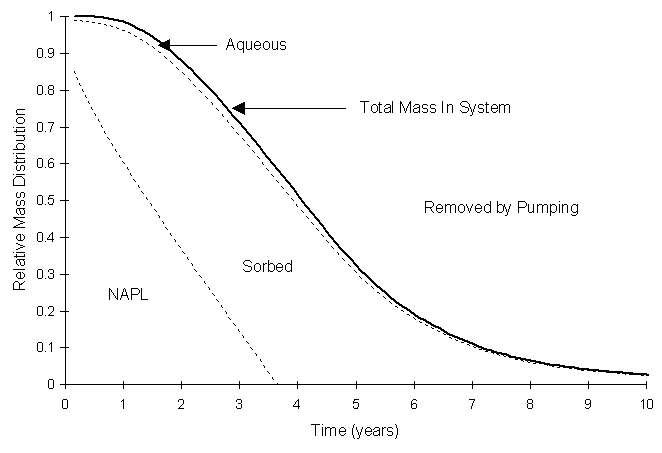
Figure 5.5.3 Pump and Treat with Biodegradation Mass Distribution
At ten years, only 0.0006% of the original TCE contamination exited the system at the boundary; biodegradation accounted for 0.013%. It appears that the zone of biostimulation is having little influence on the TCE concentration in the region of backwards flow. To further study this, consider the distribution of biomass in the aquifer at 7.8 years illustrated in Figure 5.5.4.
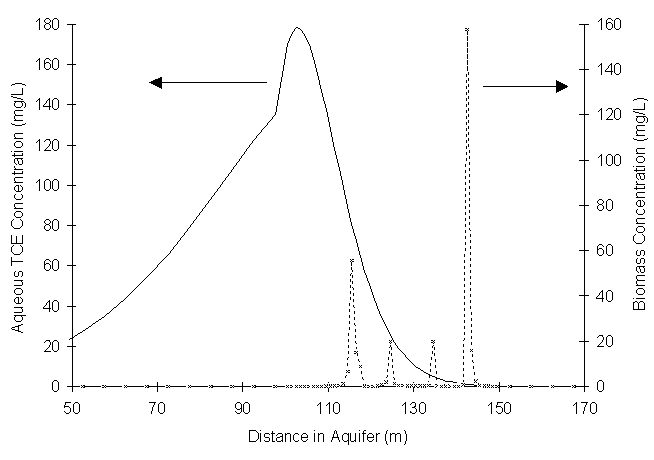
Figure 5.5.4 Distribution of Biomass and TCEaq after 7.8 years.
Figure 5.5.4 shows that biomass growth concentrated in four spikes. In addition, biomass growth exceeds the 20 mg/L target concentration in two places. This occurs because the equation used to regulate methane injection attempts to promote a biomass concentration of 20.0 mg/L at the node itself. Due to lack of oxygen at the injection node, biomass is not growing at this location, causing a higher methane concentration to be injected. The methane travels to a neighboring node where, with a sufficient oxygen supply, excessive growth occurs.
These results suggest that constant injection may not be a suitable method to deliver nutrients to the subsurface. Even when different wells are used to inject the electron acceptor and donor, excessive biomass growth still occurs where the two nutrient fronts meet. It may be necessary to use an alternating injection scheme like the one used by Semprini and McCarty (1991) in their biostimulation experiments.
Figure 5.5.5 illustrates the distribution of nutrients and biomass at 7.8 years.
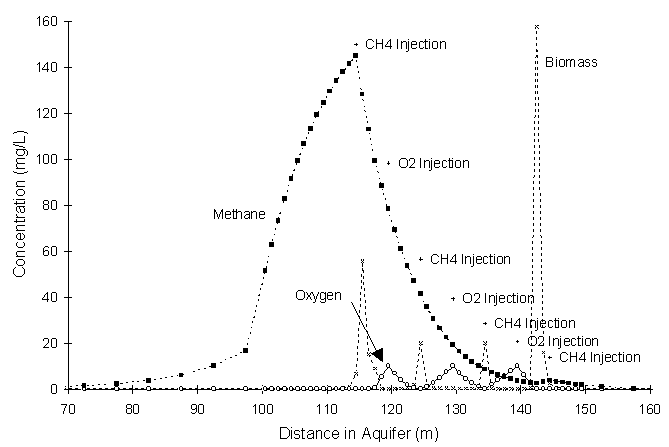
Figure 5.5.5 Distribution of Biomass, Oxygen, and Methane after 7.8 years.
Figure 5.5.5 not only illustrates the peaking of biomass concentrations at places other than injection nodes, it shows that this situation can not occur in the real world. Methane concentrations cannot reach values of 150 mg/L. The maximum solubility of methane in water is approximately 24 mg/L. The model was not programmed to take this into account.
TCE concentrations are too high for bioremediation to work in this case. Equation (5.21) gives the minimum methane concentration to maintain biomass growth. Intermediate toxicity and competitive inhibition by TCE will cause biomass concentrations to drop if methane concentration is less than this value. For example, TCE concentrations greater than 12.1 mg/L will cause biomass to decay when the methane concentration is 20 mg/L (a practical injection concentration limit). Unfortunately, TCE concentrations are much higher than 12.1 mg/L.
| [Home] | [Table of Contents] | [Prev. Page] | [Next Page] |
| A Two Dimensional Numerical Model for Simulating the
Movement and Biodegradation of Contaminants in a Saturated Aquifer © Copyright 1996, Jason E. Fabritz. All Rights Reserved. |
|||