Figure 5.4.1 Pump and Treat Aquifer System Layout
| [TOC] | 5.4 Pump and Treat | [Prev. Page] | [Next Page] |
Figure 5.4.1 illustrates the aquifer representing the pump and treat scenario.

Figure 5.4.1 Pump and Treat Aquifer System Layout
This scenario creates a region in the aquifer consisting of flow in the opposite direction of the natural flow. The induced flow is one-tenth the magnitude of the natural flow. In addition, in the region of backwards flow, the grid spacing changes to 1.0 in order to maintain similar Courant and Peclet numbers throughout the aquifer.
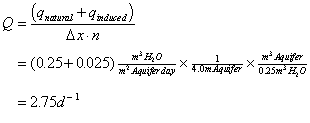
One injection trench and one extraction trench create the region of backwards flow. Node 20 contains the extraction trench. It is 102.5 m from the aquifer boundary. Equation (5.10) illustrates the calculation for the extraction flow rate:
 |
(5.10) |
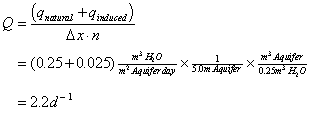
The width of the node is 4.0 m due to the change in mesh size between regions. Node 72 represents the injection trench. It is 42.5 m from the aquifer boundary. The calculation of injection flow rate is:
 |
(5.11) |
In addition this case uses the concentration profiles that exist two months into the no-action simulation. This allows for a two month reaction period from the time of the spill.
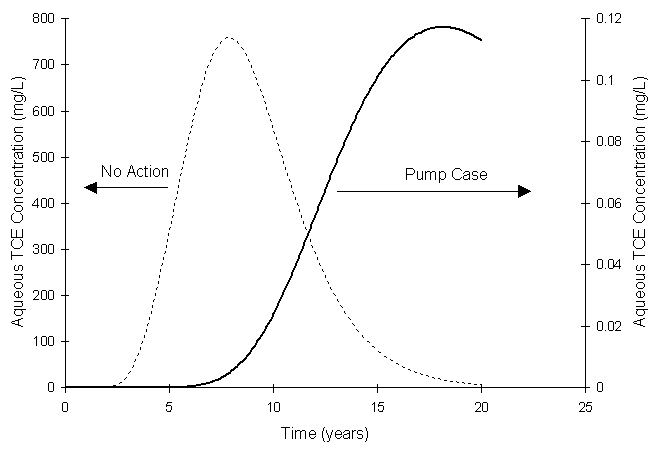
Figure 5.4.2 compares aqueous TCE boundary concentration for the no-action and pump-and-treat scenario.

Figure 5.4.2 Pump and Treat vs. No-Action Aqueous TCE Boundary
Concentration
Figure 5.4.2 shows that this implementation of pump-and-treat performs much better than the no-action scenario, but still does not meet the drinking water standard. The process of dispersion (in the direction towards the boundary) driven by concentration gradients is still great enough to overcome the advective transport (in the direction away from the boundary) induced by the injection and extraction wells. This results in a net movement of solute in a direction opposite of the fluid flow. This is not a problem with the numerical model. Using equation (2.1) with a large dispersion coefficient and low transport velocity will give net solute movement in a direction counter to the fluid flow direction.
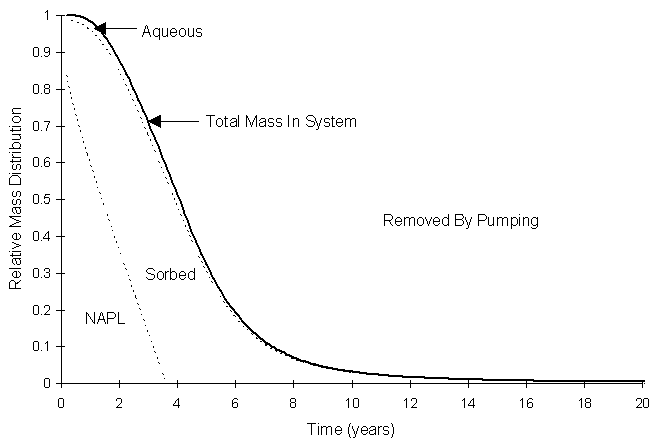
Figure 5.4.3 illustrates the distribution of mass as a function of time.

Figure 5.4.3 Pump and Treat Mass Distribution
The cumulative amount of mass exiting at the boundary at 20 years was 0.018% of the total initial mass in the system. Since this fraction was so small, it was not shown in Figure 5.4.3.
| [Home] | [Table of Contents] | [Prev. Page] | [Next Page] |
| A Two Dimensional Numerical Model for Simulating the
Movement and Biodegradation of Contaminants in a Saturated Aquifer © Copyright 1996, Jason E. Fabritz. All Rights Reserved. |
|||