| [TOC] | Appendix F Additional Kinetic Reaction Verification Tests | [Prev. Page] | [Next Page] |
This appendix continues the verification analysis of kinetic reactions from the Model Performance chapter. Refer to this chapter for details on the analysis.
The equation for single Monod decay is:
| (7.33) |
Where: d C/d t = time rate of change of concentration (M/L3·T) C = concentration of solute species (M/L3) k = maximum rate constant (T-1) Ks = half saturation constant (M/L3)
Figure F.1 compares model solutions with the true solutions using a global calculation timestep of 2.0 and varying coefficients. Circles and lines denote numerical and true solutions respectively.
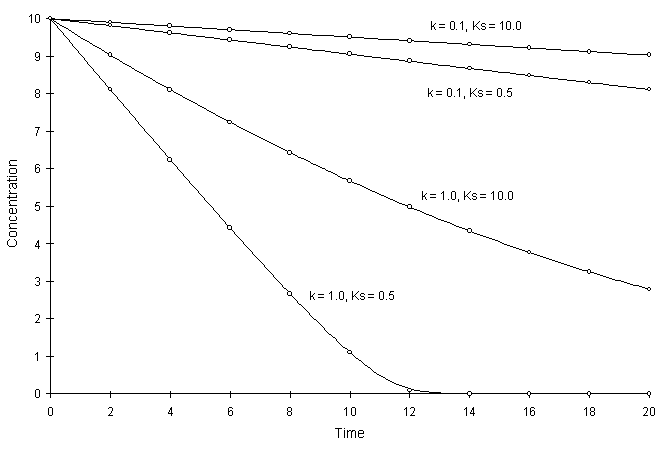
Figure F.1 Single Monod Decay with Varying k, and Ks,.
The numerical and true values appear to agree well. The squared relative residual was computed at time 20.0 for the coefficients above. Figure F.2 illustrates the results.
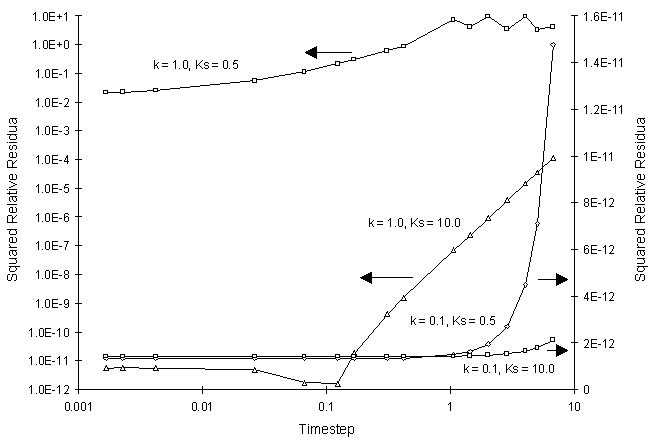
Figure F.2 Squared Relative Residual as a Function of Single Monod Decay
Coefficients and Global Timestep.
Once again, Figure F.2 shows the residual calculation is higher for higher time steps. The highest relative residual was found for the case of k = 1.0 and Ks = 0.5, where the concentration was allowed to fall to values less than 10-8.
The double Monod reaction is:
| (7.34) | |
| (7.35) |
Where: Ca = concentration of electron acceptor (M/L-3) Cd = concentration of electron donor (M/L-3) X = biomass concentration (M/L-3) k = maximum rate constant (L-6/M2·T) Ksa = half saturation constant for electron acceptor (M/L-3) Ksd = half saturation constant for electron donor (M/L-3) Ya = stoichiometry coefficient for electron acceptor Yd = stoichiometry coefficient for electron donor Yx = stoichiometry coefficient for biomass
The results are:
Figure F.3 compares model and true solutions using a global calculation timestep of 2.0. For this test k = 0.2, Ksa = 5.0, Ksd = 10.0, Yx = 0.5, YA = 1.0, YD = 2.5. Circles and lines denote numerical and true values respectively.
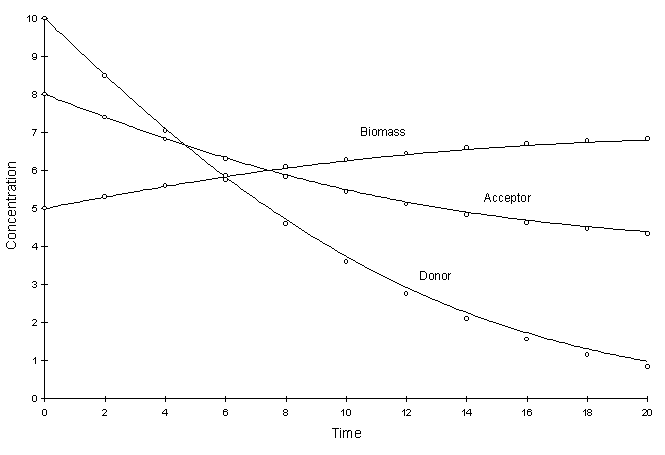
Figure F.3 Double Monod Decay. k = 0.2, Ksa = 5.0,
Ksd = 10.0, Yx = 0.5, YA = 1.0, YD
= 2.5.
It can be seen there is a small discrepancy between numerical and true values in the solution to the electron donor. The decay rate of this chemical was the largest. The squared relative residual was calculated at timestep 20.0. Figure F.4 shows the results as a function of global timestep:
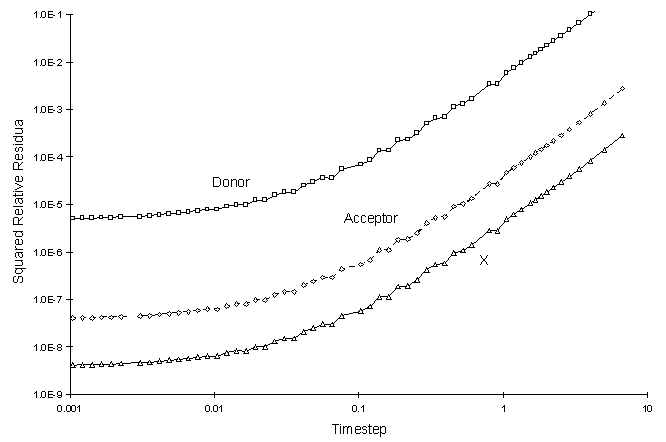
Figure F.4 Squared Relative Residual as a Function Global Timestepfor
Double Monod Reaction.
The kinetic implementation of the linear sorption isotherm is as follows:
| (7.36) |
Where: Where: C = concentration of solute species (M/L3) S = concentration of sorbed species (M/L3) a = rate coefficient (T-1) Kd = sorption coefficient
Figure F.5 compares model and true solutions using a global calculation timestep of 2.0. For this test a = 0.1 and Kd = 2.0. Circles and lines denote numerical and true values respectively.
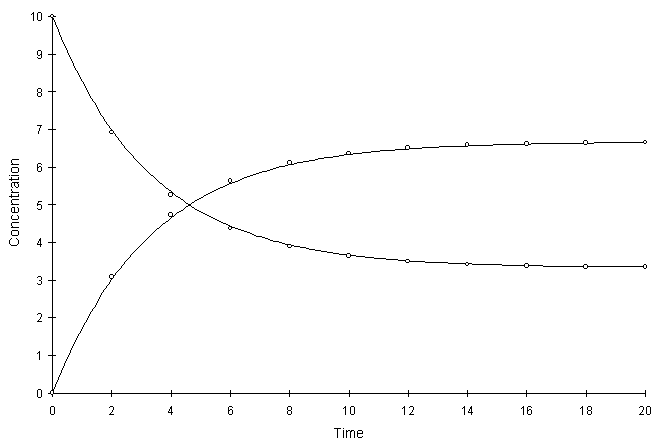
Figure F.5 Kinetic Linear Sorption, a = 0.1, Kd = 2.0.
The numerical and true values visually match quite well. The squared relative residual was calculated at timestep 10.0. Figure F.6 shows the results as a function of global timestep:
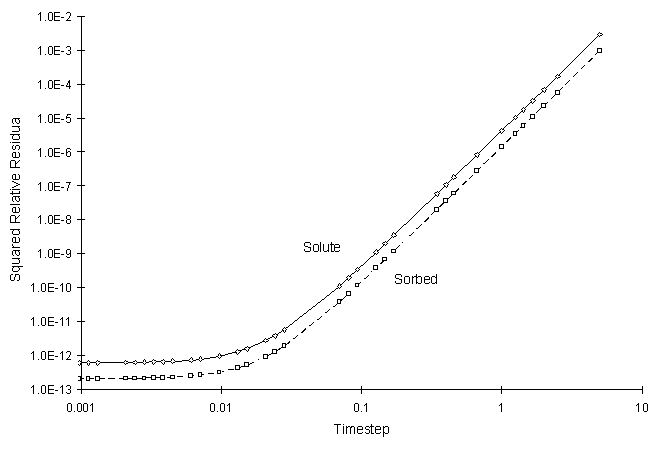
Figure F.6 Squared Relative Residual as a Function of Global Timestep for
Kinetic Linear Sorption.
The kinetic implementation of the Langmuir sorption isotherm is:
 |
(7.37) |
Where: C = concentration of solute species (M/L3) S = concentration of sorbed species (M/L3) a = rate coefficient (T-1) k1 = sorption coefficient k2 = sorption coefficient (M/L3)
Figure F.7 compares model and true solutions using a global calculation timestep of 2.0. For this test a = 0.1, k1 = 8.0, and k2 = 1.0. Circles and lines denote numerical and true values respectively.
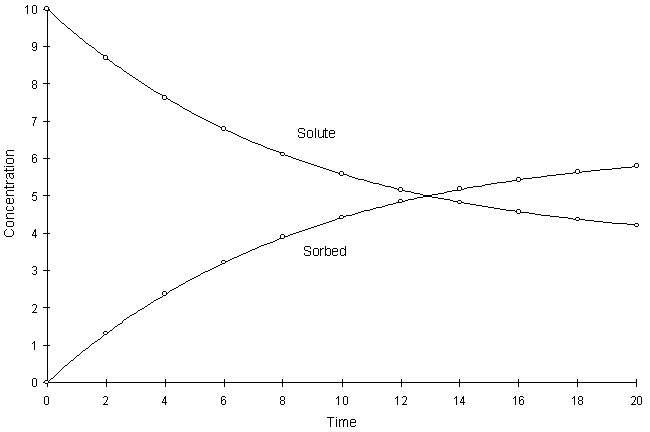
Figure F.7 Kinetic Langmuir Sorption, a = 0.1, k1 = 8.0, k2 = 1.0.
It can be seen the numerical and true values visually match quite well. The squared relative residual was calculated at timestep 20.0. Figure F.8 shows the results as a function of global timestep:
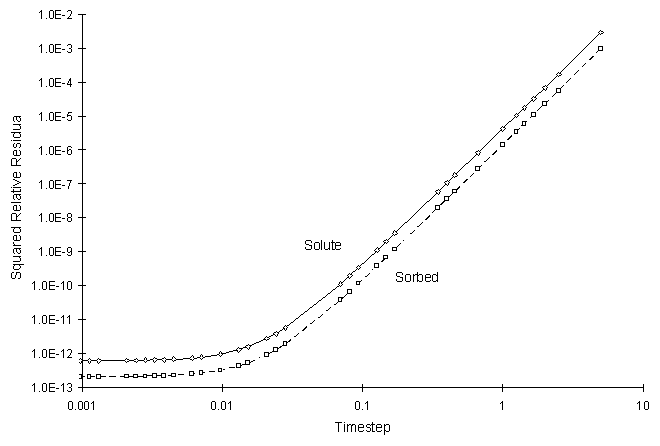
Figure F.8 Squared Relative Residual as a Function of Global Timestep for
Kinetic Langmuir Sorption.
The kinetic implementation of the Freundlich sorption isotherm is as follows:
| (7.38) |
Where: C = concentration of solute species (M/L3) S = concentration of sorbed species (M/L3) a = rate coefficient (T-1) k = sorption coefficient n = sorption coefficient
Figure F.9 compares model true solutions using a global calculation timestep of 2.0. For this test a = 0.2, k = 2.0, and n = 0.8. Circles and lines denote numerical and true values respectively.
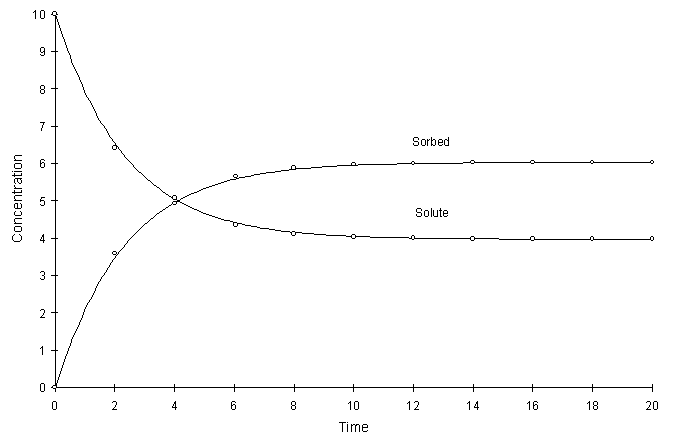
Figure F.9 Kinetic Freundlich Sorption, a = 0.2, k = 2.0, n = 0.8.
It can be seen the numerical and true values visually match quite well. The squared relative residual was calculated at timestep 6.0. Figure F.10 shows the results as a function of global timestep:
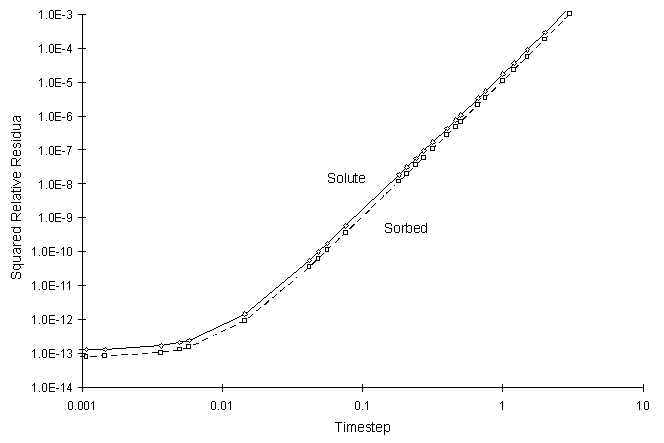
Figure F.10 Squared Relative Residual as a Function of Global Timestep for
Kinetic Freundlich Sorption.
| [Home] | [Table of Contents] | [Prev. Page] | [Next Page] |
| A Two Dimensional Numerical Model for Simulating the
Movement and Biodegradation of Contaminants in a Saturated Aquifer © Copyright 1996, Jason E. Fabritz. All Rights Reserved. |
|||