| Chapter 8. Viewing Output |
Parameter profile graphs consist of a snapshot in time of parameters along a profile in the X or Y direction. To view a profile graph, select Profile Graph from the Windows menu. If the simulation is out of date with respect to the current input parameters, the user will be prompted to update it.
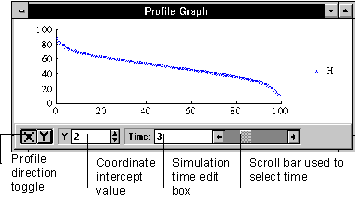
Figure 8.1 Parameter Profile Graph
Profile graphs can display more than one parameter at a time. In order to add or remove a parameter from the graph, select the desired parameter from the Parameters menu.
A profile graph can only be displayed in the X or Y direction. To toggle the
orientation of the graph, click on the ![]() or
or ![]() button for a profile in the X or Y direction
respectively.
button for a profile in the X or Y direction
respectively.
If the profile plot is oriented in the X direction, the coordinate intercept value refers to the point in the Y direction which the X profile passes through. The opposite is true for Y profile graphs.
The user can change the time of the profile plot in two ways. The easiest way is to use the scroll bar to quickly scan through the time periods for the desired time. The user can also enter a time directly in the time edit box, the closest matching time period will be displayed.
| User's Manual | Contents | Next |
� Copyright 1998, BUGBYTES, Inc. All Rights Reserved. BUGBYTES, BUGS and the Bug logo are trademarks of BUGBYTES, Inc. All other product names are trademarks, registered trademarks, or service marks of their respective owners.
Last Updated October 1, 2001