| Chapter 8. Viewing Output |
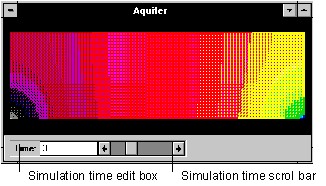
For the individual that prefers to see a larger picture than just a profile or time series at a particular point, BUGS Scratchpad can generate surface plots over the entire aquifer for a given parameter at a given point in time. To view a surface plot, select Surface Graph from the Window menu.

Figure 8.3 Surface Plot
The user can change the time of the profile plot in two ways. The scroll bar can quickly scan through the time periods for the desired time. The user can also enter a time directly in the time edit box, the closest matching time period will be displayed.
| User's Manual | Contents | Next |
� Copyright 1998, BUGBYTES, Inc. All Rights Reserved. BUGBYTES, BUGS and the Bug logo are trademarks of BUGBYTES, Inc. All other product names are trademarks, registered trademarks, or service marks of their respective owners.
Last Updated October 1, 2001