| [TOC] | 4.7 One-Dimensional Solute with First Order Decay | [Prev. Page] | [Next Page] |
This section evaluates model performance in simulating one-dimensional solute transport with first order decay. It reports RSSE as a function of Peclet, Courant, and Damkohler numbers. The analytical equation representing solute flow in the aquifer is (Poulsen, 1991):
 |
(4.8) |
Where: A = t = time (T) x = distance in X direction (L) Co = concentration at inflow boundary (M/L3) Ci = initial concentration in aquifer (M/L3) K = first order degradation coefficient (T-1) V = pore water velocity (L/T) Dl = longitudinal dispersion coefficient (L2/T)
Equation (4.8) makes the following assumptions:
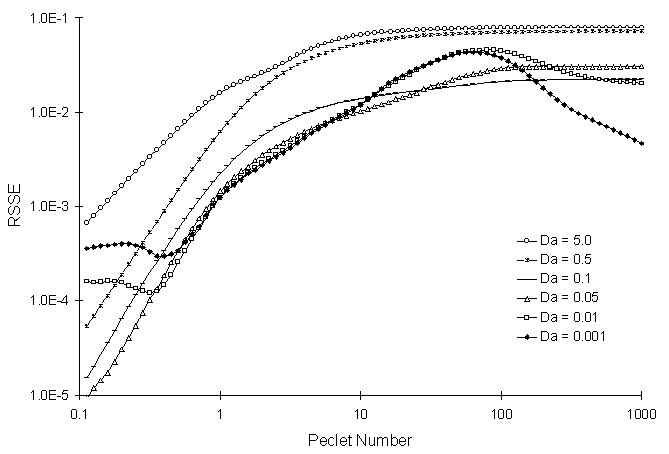
Figure 4.7.1 illustrates RSSE as a function of Pe and Da. The Courant number is calculated as a function of Peclet number using equation (3.13). This test uses an initial aquifer concentration of 0.0.

Figure 4.7.1 RSSE as a Function of Damkohler Number and Peclet Number
(using the Maximum Allowable Courant Number)
for One-Dimensional Reactive Solute Transport with a Continuous Source
Figure 4.7.2 illustrates the interaction of advective-dispersive and decay processes and how they effect model performance. Intuitively, it makes sense that increasing the Damkohler number will decrease model performance. This is the case in highly advective systems (high Peclet numbers). However, for highly dispersive systems (small Peclet numbers) it appears that there is an optimal Damkohler number. For conservative systems with a continuous source, the optimal Peclet number appears to be around 3.0 (see Figure 4.4.1). Decreasing peclet numbers below 3.0 results in higher RSSE values. However, the addition of first order decay appears to counteract the processes responsible for increasing the RSSE value as Peclet number decreases.
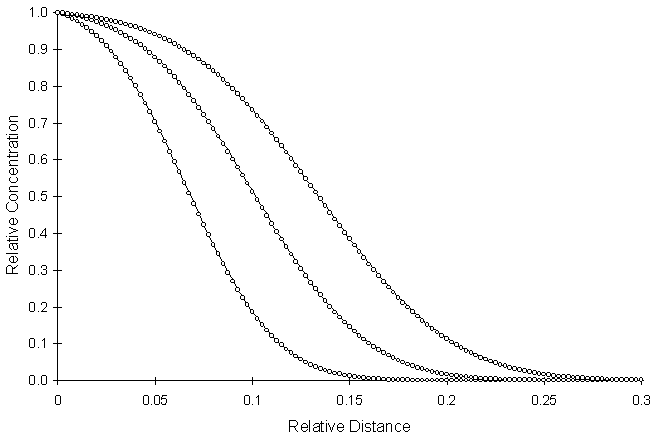
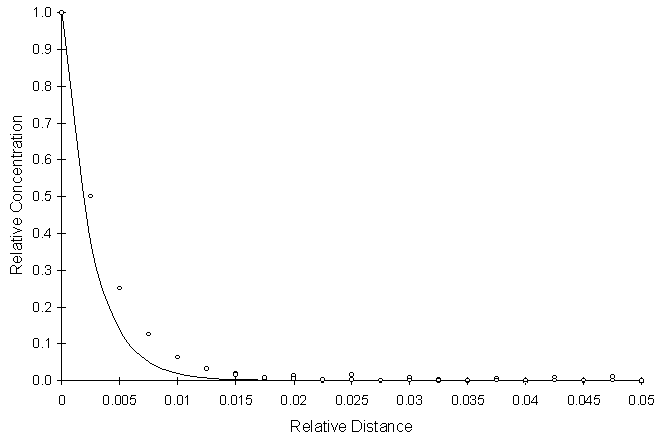
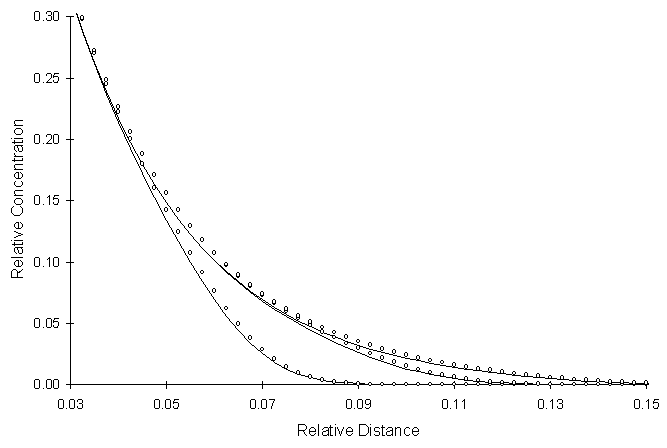
Figure 4.7.2 through Figure 4.7.4 illustrate solute profiles at various combinations of dimensionless parameters.

Figure 4.7.2 One-Dimensional Reactive Solute Transport with Continuous
Source, Pe = 0.2, Co = 0.099, Da = 0.001, RSSE = 4.02 x 10⁻⁴
Figure 4.7.2 illustrates a highly dispersive system with a low decay rate.

Figure 4.7.3 One-Dimensional Reactive Solute Transport with Continuous
Source, Pe = 100, Co = 0.9905, Da = 1.0, RSSE = 1.14 x 10⁻¹
Figure 4.7.3 illustrates a highly advective system with a moderately high decay rate. It appears that numerical solution leads the analytical solution. However the scale representing the relative distance in this simulation is small compared to Figure 4.7.2.

Figure 4.7.4 One-Dimensional Reactive Solute Transport with Continuous
Source, Pe = 2, Co = 0.618, Da = 0.1, RSSE = 5.7 x 10⁻³
Figure 4.7.4 illustrates a moderately dispersive system with a moderate decay rate. It appears the numerical solution leads the analytical solution as in Figure 4.7.3.
| [Home] | [Table of Contents] | [Prev. Page] | [Next Page] |
| A Two Dimensional Numerical Model for Simulating the
Movement and Biodegradation of Contaminants in a Saturated Aquifer © Copyright 1996, Jason E. Fabritz. All Rights Reserved. |
|||