| [TOC] | 4.6 Two-Dimensional Conservative Solute Transport | [Prev. Page] | [Next Page] |
This section evaluates model performance in simulating the transport of a conservative solute in two dimensions. It uses the analytical solution to the case of a solute pulse injection. The analytical solution to two-dimensional solute transport is (Fetter, 1994):
 |
(4.7) |
Where: t = time (T) x = distance in X direction (L) y = distance in Y direction (from centerline of flow) (L) Co = initial concentration of pulse (M/L3) A = area of pulse application (L2) V = pore water velocity (L/T) (in X direction, no flow in Y direction) Dl = longitudinal (X direction) dispersion coefficient (L2/T) Dt = transverse (Y direction) dispersion coefficient (L2/T)
Equation (4.7) makes the following assumptions about the initial and boundary conditions:
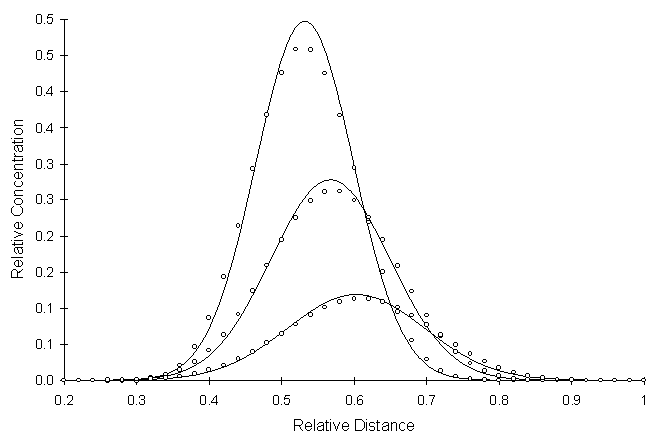
Figure 4.6.1 illustrates cross-sectional profiles of numerical and analytical solutions. This test used a dispersitivity ratio (a l/a t) of 10. The angle of flow in the aquifer is at 30º from the X axis. Circles and lines represent numerical and analytical values, respectively.

Figure 4.6.1 Two-Dimensional Conservative Solute Transport with a Pulse
Source,Cross-sectional Profiles at a
Relative Distance of Y = 0.50 Pe = 0.5, Co = 0.082, a l/a t = 10, Flow Angle = 30º
Figure 4.6.1 illustrates a simulation with low Peclet and Courant numbers. This combination of Courant and Peclet numbers falls inside the region of no oscillations in Figure 3.8.1.
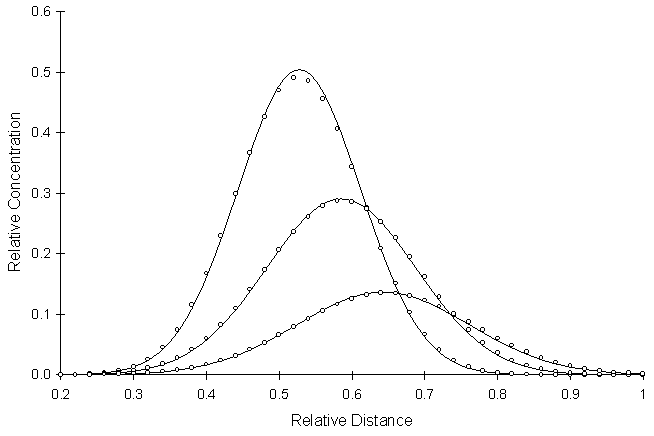
Figure 4.6.2 illustrates a simulation using a dispersitivity ratio of 5.0.

Figure 4.6.2 Two-Dimensional Conservative Solute Transport with a Pulse
Source,Cross-sectional Profiles at a
Relative Distance of Y = 0.50 Pe = 0.5, Co = 0.082, a l/a t = 5, Flow Angle = 30º
A comparison of Figure 4.6.1 and Figure 4.6.2 illustrates that decreasing the dispersitivity ratio improves model performance. Numerical experimentation has shown this to be the case in general.
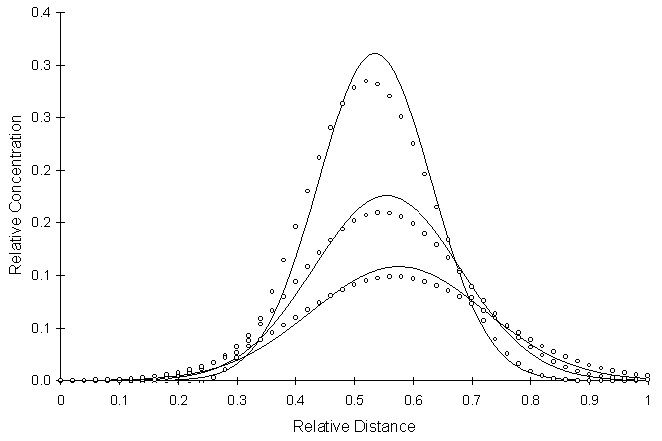
Figure 4.6.3 illustrates a simulation using a dispersitivity ratio of 20.0.

Figure 4.6.3 Two-Dimensional Conservative Solute Transport with a Pulse
Source,Cross-sectional Profiles at a
Relative Distance of Y = 0.50 Pe = 0.1, Co = 0.049, a l/a t = 20.0, Flow Angle = 30º
Once again, Figure 4.6.3 shows that performance deteriorates as the dispersitivity ratio increases.
This analysis assumes that if model performance is satisfactory at a 30º angle, it will in turn be satisfactory at all flow angles. Numerical experimentation has confirmed this assumption.
| [Home] | [Table of Contents] | [Prev. Page] | [Next Page] |
| A Two Dimensional Numerical Model for Simulating the
Movement and Biodegradation of Contaminants in a Saturated Aquifer © Copyright 1996, Jason E. Fabritz. All Rights Reserved. |
|||