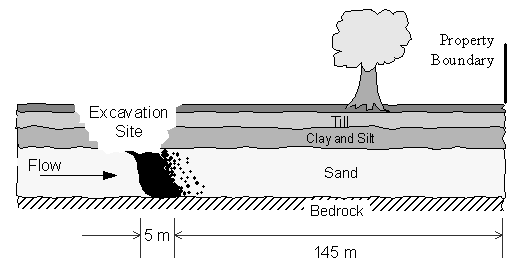
Figure 5.2.1 TCE Spill Site
| [TOC] | 5.2 Problem Description | [Prev. Page] | [Next Page] |
Figure 5.2.1 illustrates the contaminated aquifer.

Figure 5.2.1 TCE Spill Site
A 5 meter long zone in the aquifer is contaminated with a residual TCE saturation (Q r) of 0.0625. The spill occurred 145 m from the property boundary. The objective of remediation is to maintain a TCE drinking water standard of 0.005 mg/L at the property boundary.
Table 5.2.1 presents the aquifer properties for this example. They were selected from values reported in the literature for sandy aquifers. Table 5.2.2 presents TCE and biological parameters reported in Semprini et al. (1991b, 1992), Alvarez-Cohen et al., (1993), and Sleep and Sykes (1993).
Table 5.2.1 Aquifer Material Properties
| Property | Symbol |
Value |
|---|---|---|
| Porosity | n | 0.25 |
| Solids Density (g/cm3) | r s | 2.65 |
| Material Bulk Density (g/cm3) | r b | 1.9875 |
| Hydraulic Conductivity (m/d) | K | 8.46 |
| Hydraulic Gradient | dh/dl | 2.98 x 10⁻² |
| Linear Specific Discharge (m3/m2·d) | q | 0.25 |
| Linear Pore Water Velocity (m/d) | V | 1.0 |
| Longitudinal Dispersitivity (m) | a l | 10 |
| Methanotrophic Bacteria Concentration (mg/L) | Xo | 0.1 |
Table 5.2.2 TCE Sorption and Biodegradation Coefficients
| Property | Symbol |
Value |
|---|---|---|
| Partitioning Coefficient (L/kg) | Kd | 2.0 |
| Sorption Rate Coefficient (d-1) | a s | 0.2 |
| Maximum Transformation Rate (d-1) | k2 | 0.01 |
| Half-Saturation Coefficient (mg/L) | KS2 | 1.0 |
| Aqueous Solubility (mg/L) | Csol | 1100 |
| Liquid Density (kg/m3) | r TCE | 1467 |
| Maximum Substrate Utilization Rate (d-1) | k | 1.2 |
| Methane Half-Saturation (mg/L) | KSD | 2.0 |
| Oxygen Half-Saturation (mg/L) | KSA | 1.0 |
| Biomass Yield Coefficient (mg biomass/mg CH4) | Y | 0.5 |
| Cell Decay Coefficient (d-1) | b | 0.15 |
| Oxygen Ratio for Growth (mg O2/mg biomass) | F | 2.4 |
| Biodegradable Cell Fraction | fd | 0.8 |
| Cell Decay Oxygen Demand (mg O2/mg biomass) | dc | 1.42 |
| Intermediate Toxicity Coeff. (mg biomass/mg TCE) | a TOX | 20.83 |
This chapter analyzes three remedial alternatives: no-action, pump and treat, and pump and treat with bioremediation.
| [Home] | [Table of Contents] | [Prev. Page] | [Next Page] |
| A Two Dimensional Numerical Model for Simulating the
Movement and Biodegradation of Contaminants in a Saturated Aquifer © Copyright 1996, Jason E. Fabritz. All Rights Reserved. |
|||