Figure 5.3.1 No Action Aquifer System Layout
| [TOC] | 5.3 No-action | [Prev. Page] | [Next Page] |
Figure 5.3.1 illustrates the aquifer representing the no-action scenario.

Figure 5.3.1 No Action Aquifer System Layout
The discretized aquifer uses a uniform grid spacing of 5.0 m. A grid spacing of 5.0 m will allow for rapid calculation of solute movement (large Dt) at the expense of grid mesh resolution. Since simulation length is on the order of years, not days, larger time steps are required to reduce computational requirements. The simulation will run for 7 years, printing results every month.
The inflow rate is in terms of pore space fraction per time. It derives from the specific discharge in the aquifer.
 |
(5.1) |
This simulation adds only three parameters; aqueous TCE, sorbed TCE, and NAPL TCE. Table 5.3.1 shows the properties of the parameters.
Table 5.3.1 No-Action Simulation Parameters
| Parameter | Type |
Initial Value |
Comment |
|---|---|---|---|
| TCE (NAPL) | Immobile | 46.13 g/kg Dry Wt. | Initial value only in places where TCE was spilled, otherwise value is zero. |
| TCE (aq) | Mobile | 0 mg/L | Aqueous TCE species |
| TCE (s) | Immobile | 0 mg/kg Dry Wt. | Sorbed TCE species |
The problem description presented TCE contamination in terms of residual saturation. The following equation calculates the initial concentration presented in Table 5.3.1.
 |
(5.2) |
The simulation neglects any effect of TCE residual saturation on the water saturation.
Two reaction processes occur in the no-action case: TCE dissolution and TCE sorption. This simulation explores both instantaneous and kinetic dissolution and equilibrium linear sorption.
The model uses the following equations to represent TCE dissolution rate:
| (5.3) |
Where: TCE(aq) = aqueous TCE concentration (mg/L) a d = dissolution rate constant (¥ d-1) TCEsol = TCE solubility (1100 mg/L)
For equilibrium dissolution case a d is infinity, the simulations will use an instantaneous rate equation. The second part of representing TCE dissolution is the mass balance between the two phases. The conversion from TCE NAPL to aqueous phase TCE is.
 |
(5.4) |
The resulting stoichiometric equation is:
| (5.5) |
The equation representing TCE sorption is:
| (5.6) |
Where: TCE(s) = sorbed phase TCE concentration (mg/kg Dry Wt.) a s = sorption rate coefficient (0.2 d-1 or ¥ d-1) Kd = linear partitioning coefficient (2.0 L/kg Dry Wt.) TCE(aq) = aqueous phase TCE concentration (mg/L)
In the case where a s is infinity, the model will use the following equilibrium relationship:
| (5.7) |
The aqueous and sorbed phase TCE values are in different units. The conversion from sorbed TCE to aqueous TCE is:
 |
(5.8) |
The resulting stoichiometric equation is:
| (5.9) |
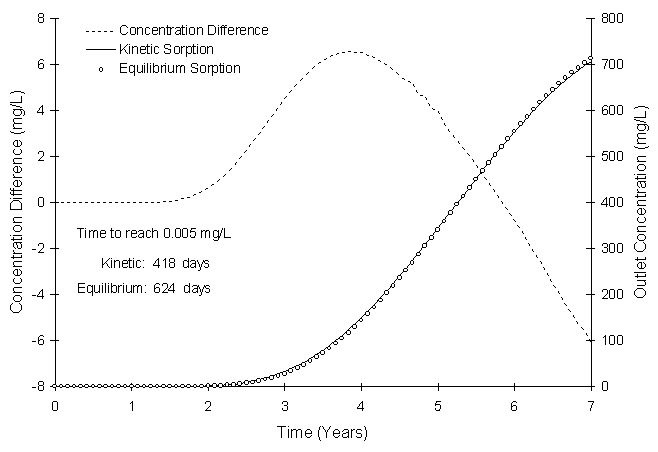
Figure 5.3.2 illustrates the boundary TCE concentration as a function of time using equilibrium and kinetic sorption isotherms.

Figure 5.3.2 No Action TCE Border Concentration using Kinetic and
Equilibrium Sorption
Figure 5.3.2 shows there is little difference between solutions. Subsequent simulations will use equilibrium sorption because it is computationally faster.
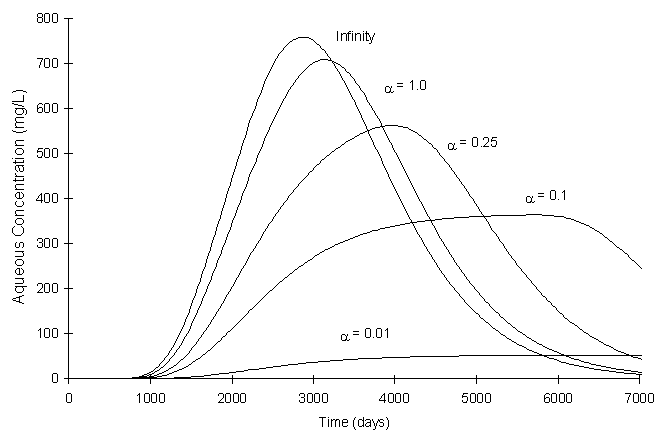
Figure 5.3.3 illustrates boundary concentration sensitivity to different dissolution rates using equilibrium sorption.

Figure 5.3.3 No Action TCE Border Concentration with different dissolution
rates
Figure 5.3.3 shows that the dissolution rate makes a large difference in the results. The problem description did not give a dissolution rate constant. An instantaneous dissolution process will represent dissolution because it provides for the largest peak concentration at the boundary.
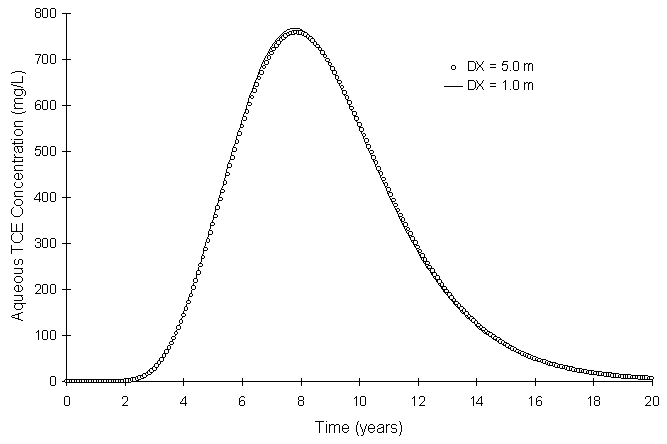
Figure 5.3.4 illustrates simulation sensitivity to grid spacing. It compares boundary concentrations using the discretized aquifer described above (D x = 5.0 m) and a similar aquifer using a grid spacing of 1.0 m.

Figure 5.3.4 No Action TCE Border Concentration using different grid
spacing
Figure 5.3.4 shows little difference in results. The 5 m aquifer mesh took 14 minutes real time to simulate 20 years while the 1.0 m mesh took 7 hours real time. This is due to a five-fold increase in the number of nodes, a five-fold decrease in the Peclet number causing a ten-fold decrease in the maximum allowable Courant number.
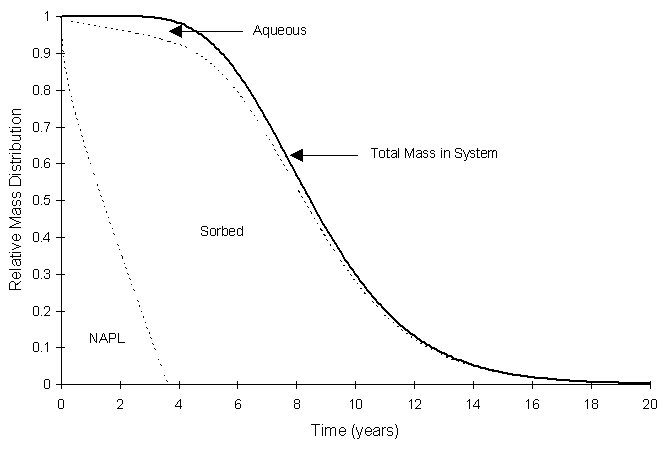
Figure 5.3.5 illustrates the distribution of mass in the first 20 years. "Total mass in System" refers to the sum of NAPL, sorbed TCE, and aqueous TCE inside the aquifer boundary.

Figure 5.3.5 No Action Distribution of Mass
It appears that it takes more than three years for the TCE NAPL to completely dissolve.
| [Home] | [Table of Contents] | [Prev. Page] | [Next Page] |
| A Two Dimensional Numerical Model for Simulating the
Movement and Biodegradation of Contaminants in a Saturated Aquifer © Copyright 1996, Jason E. Fabritz. All Rights Reserved. |
|||