Figure 4.9.1 Laboratory Column
| [TOC] | 4.9 Stratified Porous Media | [Prev. Page] | [Next Page] |
In 1985, Sudicky, Gillham, and Frind conducted multiple tracer tests with a column containing stratified porous media. The purpose of these experiments was to "examine the diffusion of a non-reactive tracer in layered media under controlled laboratory conditions." They compared three theoretical equations using different assumptions to laboratory results. The theoretical model termed the "Thick-Layer solution" best fit the experimental results.
This section evaluates model performance in simulating an aquifer of moderate complexity. It uses the model to simulate the column used by Sudicky et al. The model is parameterized with the same material properties and boundary conditions which existed in the column. The results compare favorably with the "Thick-Layer" analytical solution.
The following figure illustrates the basic configuration of the column used by Sudicky et al.

Figure 4.9.1 Laboratory Column
The dimensions of the column were 1.0 x 0.2 x 0.1 meters. It was packed with two materials: silt and sand. The hydraulic conductivity of the sand was experimentally determined to be 2.3 x 10⁻⁴ m/s. The conductivity of the silt was assumed to be 6 x 10⁻⁸ m/s. The porosity of the silt was found to be 0.36 by independent experimentation. The porosity of the sand was assumed to be 0.33. The effective diffusion coefficient of 1.21 x 10⁻⁹ m2/s was determined by experimentally fitting the "Thick-Layer" model. The dispersitivity values a l and a t were assumed to be negligible and were set at zero.
The numerical model was tested against the second experiment in the literature. A sodium chloride solution containing 100.0 mg/L Cl- was placed in a constant head reservoir at the inlet end of the column. The pore water velocity used was 0.50 m/d in the sand layer. The initial concentration of Cl- in the column was zero. After seven days of Cl- input, the influent solution was changed to a chloride free solution.
The fundamental equation describing solute transport in the column for the "Thick-Layer" solution is represented in Equation (4.12) below. Equation (4.12) is derived using four assumptions. First, the thickness of the sand layer is much smaller than its length. Second, the hydraulic conductivity of the silt is low and the resulting transport within the silt is by molecular diffusion only. Third, transport in the sand layer is much faster than in the silt. Finally, if local longitudinal dispersion in the sand layer is neglected, the equation describing two-dimensional solute transport of tracer in the sand is:
| (4.12) | |
|
|
| (4.13) | |
| (4.14) | |
| (4.15) | |
| (4.16) | |
| (4.17) |
Where: Dt = vs = velocity in the sand layer (L/T) a t = transverse dispersitivity coefficient (L) D* = effective diffusion coefficient (L2/T) n = porosity in the sand layer n’ = porosity in the silt layer C = concentration in the sand layer C’ = concentration in the silt layer 2b = width of the sand layer
In addition, the direction of the solute flux in the sand layer was assumed to be perpendicular to the sand layer axis. The solution to the above system of equations can be found in Sudicky et al. (1985).
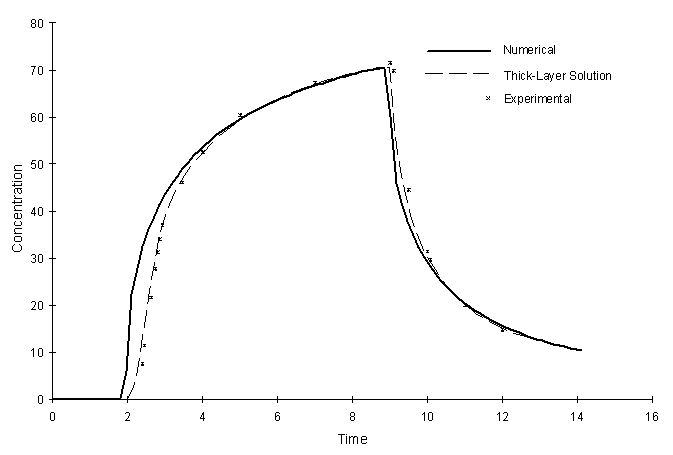
The experimental column system described above was entered into the numerical model. The grid spacing in the X and Y directions are 0.0125 m and 0.005 m respectively. The analytical solution assumes Dl = 0. However, this is impossible to represent in the implementation of the numerical model. In the numerical model Dl = D*. Figure 4.9.2 illustrates the results of the test:

Figure 4.9.2 Concentration at outflow boundary for Stratified System.
It can be seen in Figure 4.9.2, the numerical and analytical values agree quite well, except for the solute front arrival times. The numerical model profile arrives before the analytical solution. As mentioned before, the analytical solution assumes Dl = 0. Therefore, it is impossible for the profile to arrive prior to 2 days. It was impossible to set Dl = 0. in the model because D* = 1.21 x 10⁻⁹ m2/s. The solute profile undergoes lateral dispersion and arrives sooner than the analytical solution predicts. This should not be interpreted as a problem with the numerical model.
| [Home] | [Table of Contents] | [Prev. Page] | [Next Page] |
| A Two Dimensional Numerical Model for Simulating the
Movement and Biodegradation of Contaminants in a Saturated Aquifer © Copyright 1996, Jason E. Fabritz. All Rights Reserved. |
|||